

ALABAMA REVENUE CYCLE AUDIT
HLA CONFERENCE SPECIAL: $250
Normally $1,499
✓ Analyze 18 months of claims and remittance data.
✓ Interactive audit workspace with 14 days of access.
✓ Results within 24 hours of receiving credentials.
Conference offer available through 8/15/2026. Eligibility requirements apply.
Modernize Your Revenue Cycle. One Audit at a Time.
Most practices know there's revenue being left behind.
The difficult part is knowing where, why, and what to fix first.
RevOps Health Audit gives you a comprehensive assessment of your revenue cycle using the same analytics platform that powers our continuous surveillance solution.
We'll analyze 18 months of historical claims and remittance data, identify revenue opportunities, quantify operational risk, surface denial patterns, and give you the tools to investigate every finding down to the individual claim.
No software installation.
No workflow disruption.
No long term commitment.
Just a comprehensive audit of your revenue cycle and a clear path forward.


Start at 30,000 feet
Every audit begins with Essex, our executive command center.
Instead of overhwelming you with reports, Essex immediately answers the questions leadership cares about most.
How much revenue is currently at risk?

What has changed recently?
Where are collections improving?
Which opportunities deserve attention first?
Within minutes you’ll understand the overall health of your revenue cycle and where to focus first.
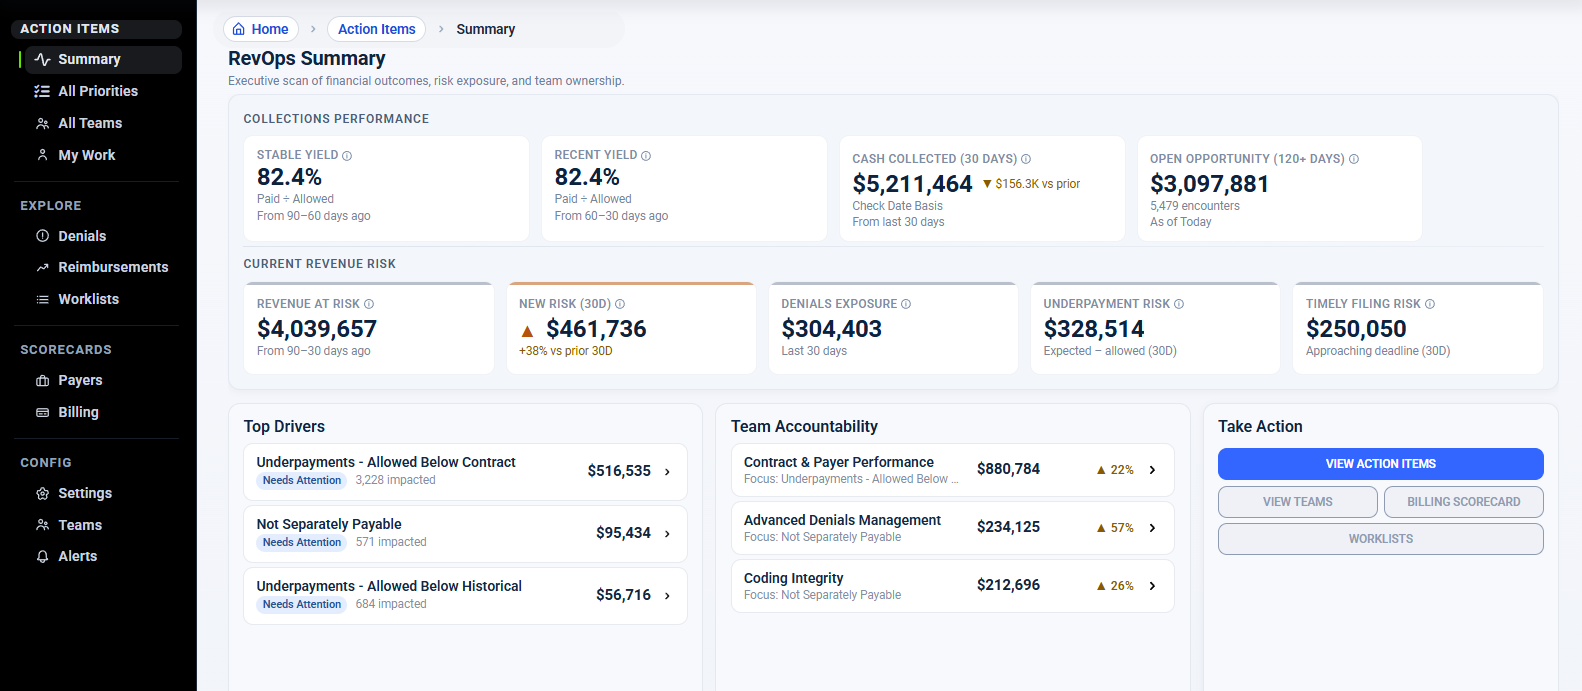
What new risks have emerged over the last 30 days?
Turn Thousands of Claims into a Prioritized Action List
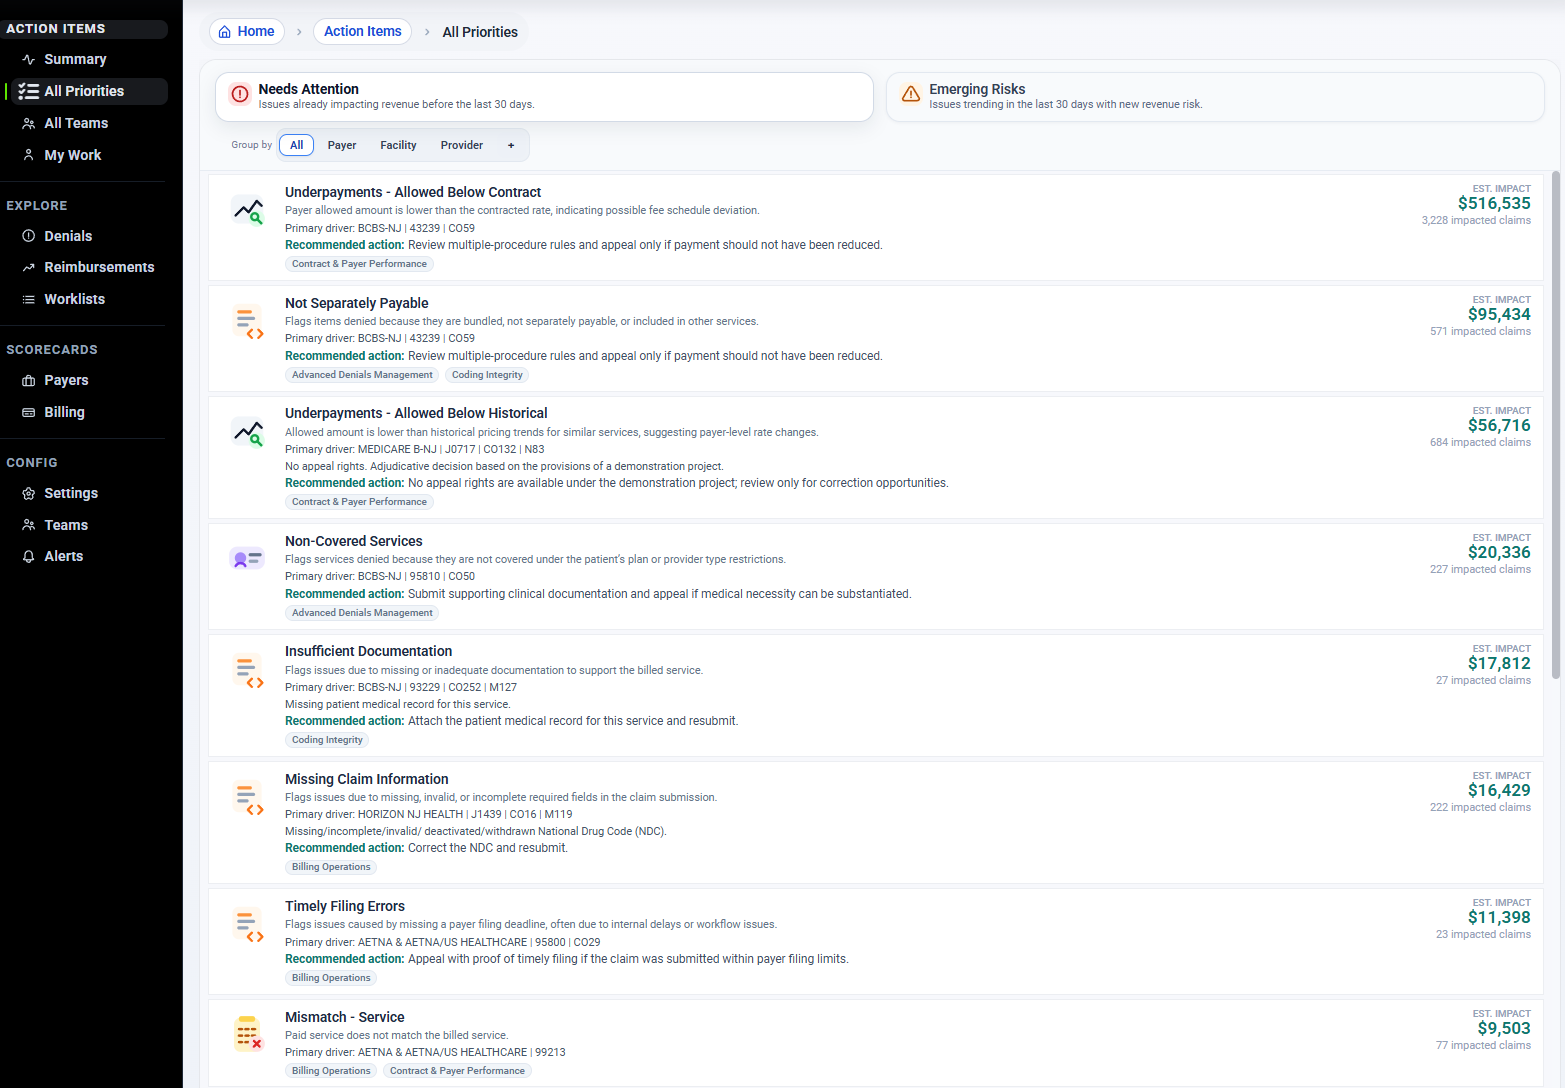
Finding problems isn't enough.
You need to know which ones matter.
RevOps Health automatically evaluates your claims and remittances to identify meaningful operational patterns including:
Silent downcoding
Underpayments
Missing prior authorization
Invalid insurance
Missing claim information
Benefit maximums
Non covered services
Insufficient documentation
Not separately payable procedures
Coding anomalies
Every opportunity is quantified in real dollars, allowing you to focus on the issues with the greatest financial impact.
Understand Why It’s Happening
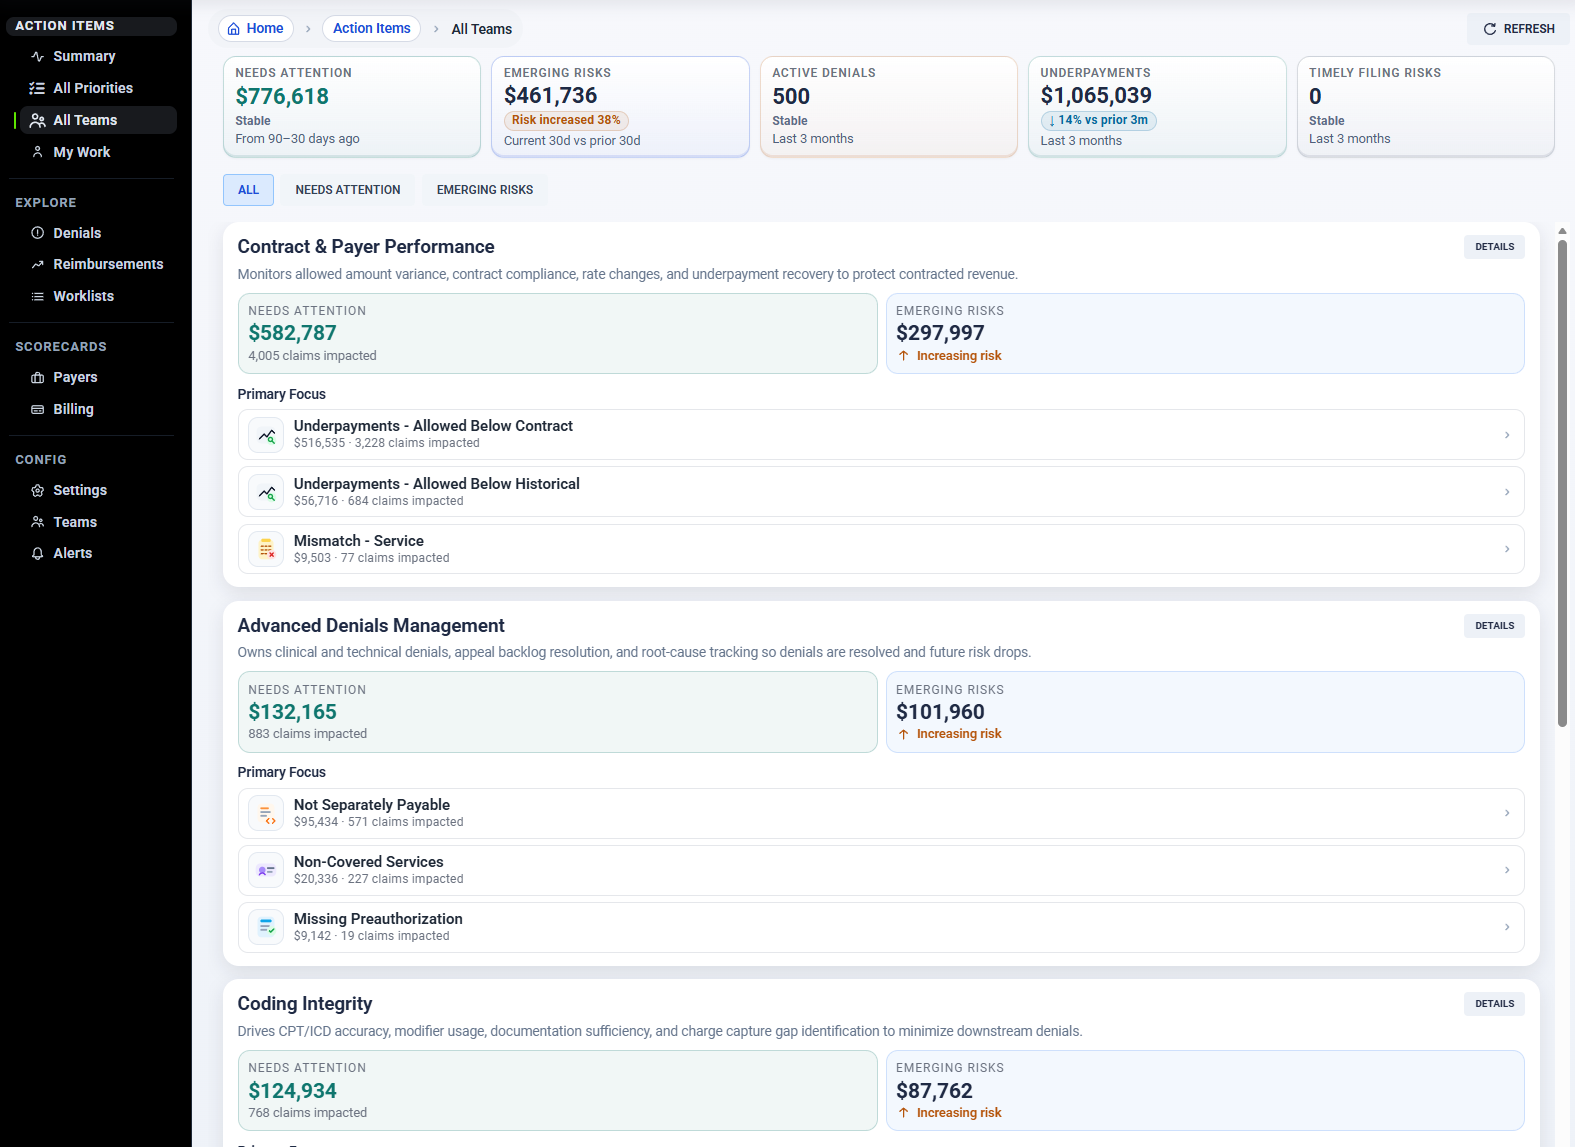
The platform organizes every finding around the operational team responsible for fixing it.
Instead of asking, “What happened?”
You begin asking, “Why is this happening?”
Review performance across:
Coding Integrity
Billing Operations
Revenue Operations
Registration
Contract Performance
Payer Performance
Advanced Denials Management
Each scorecard highlights ongoing operational issues, emerging risks, and the financial impact of each.
Compare Performance Across Your Entire Organization
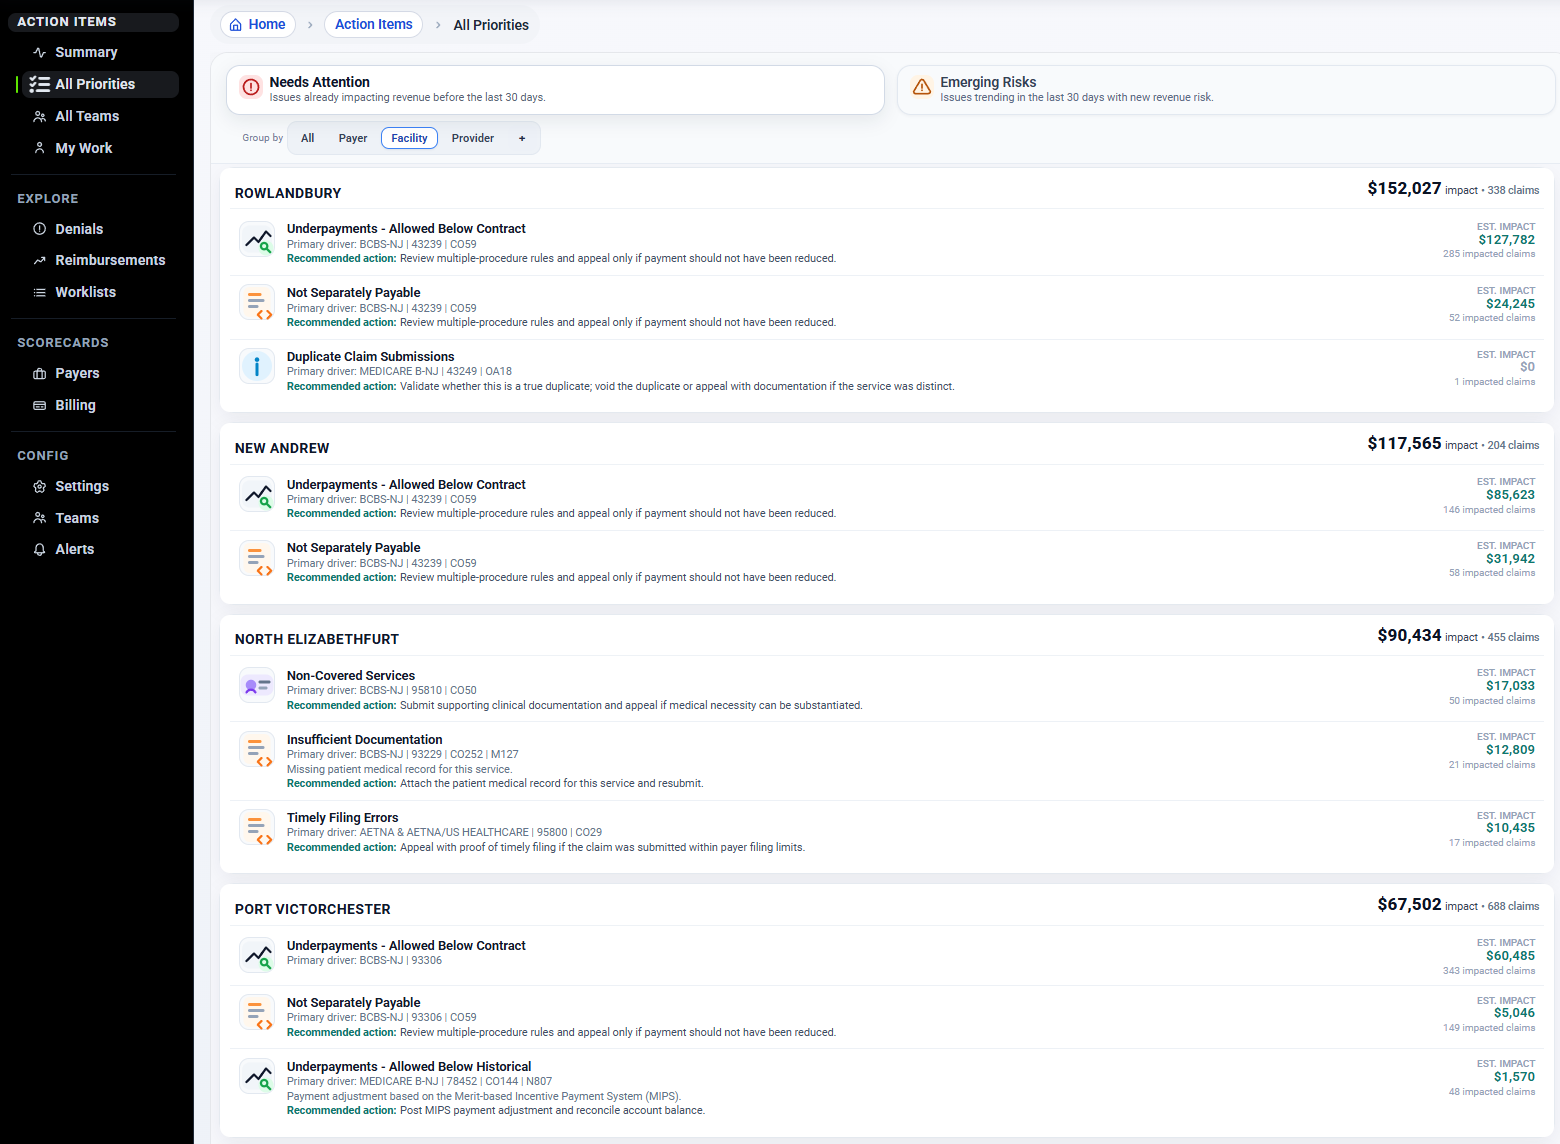
Every practice is different.
That’s why every dashboard can be reorganized around your business.
Compare performance by:
Provider
Facility
Payer
State
Speciality
Business Unit
Service Line
Whether you’re managing one office or hundreds of providers, every view adapts to the way your organization operates.
Identify the Patterns Behind Your Revenue
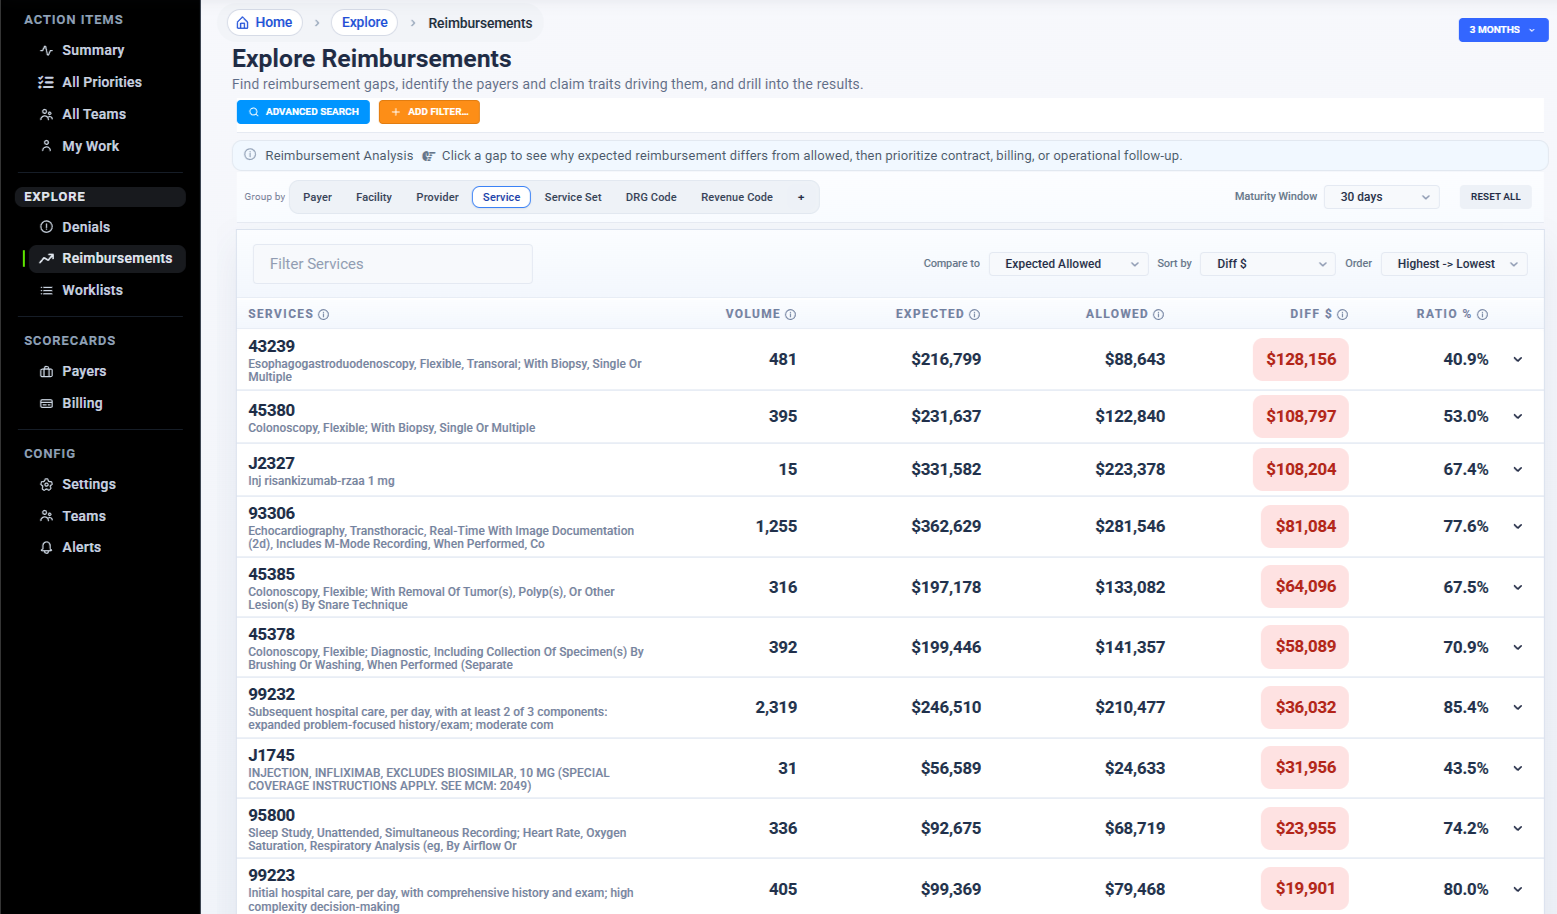
Revenue cycle problems rarely happen in isolation.
RevOps Health helps you identify trends across your entire operation.
Analyze:
Expected reimbursement
Actual reimbursement
Collection percentages
Procedure volume
Historical reimbursement
Payment trends
Quickly recognize which providers, payers, locations, or services are driving performance and which deserve additional attention.
Understand Your Payers
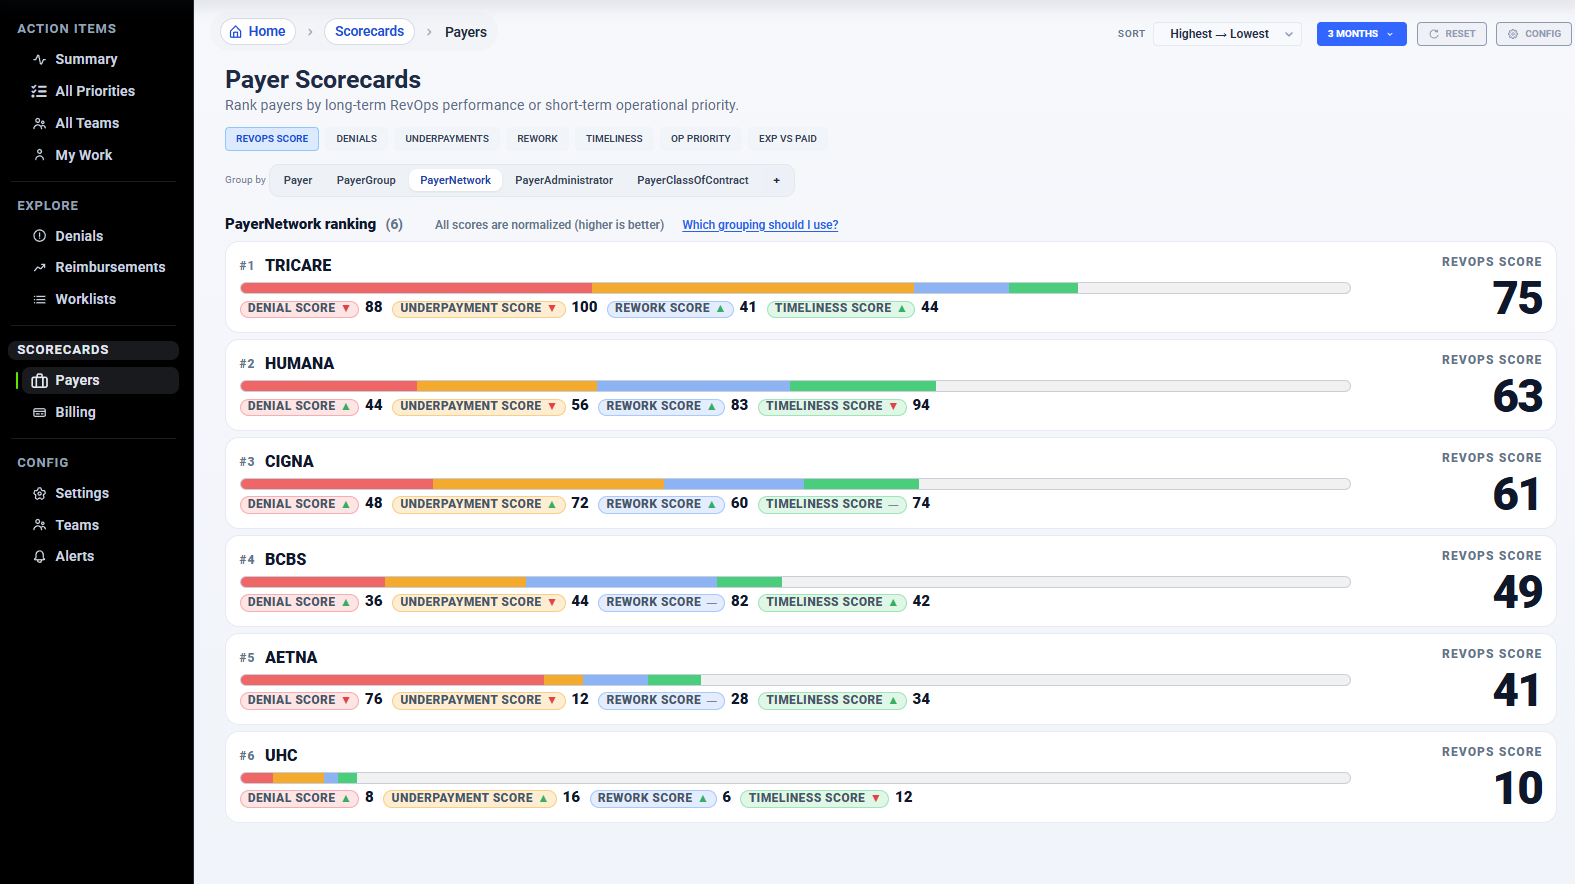
Not every payer performs equally.
The audit evaluates payer relationships using operational metrics including:
Denials
Underpayments
Payment timeliness
Administrative burden
Rework
Overall payer performance
Know which payer relationships are supporting your business and which are creating unnecessary friction.
Measure Billing Performance
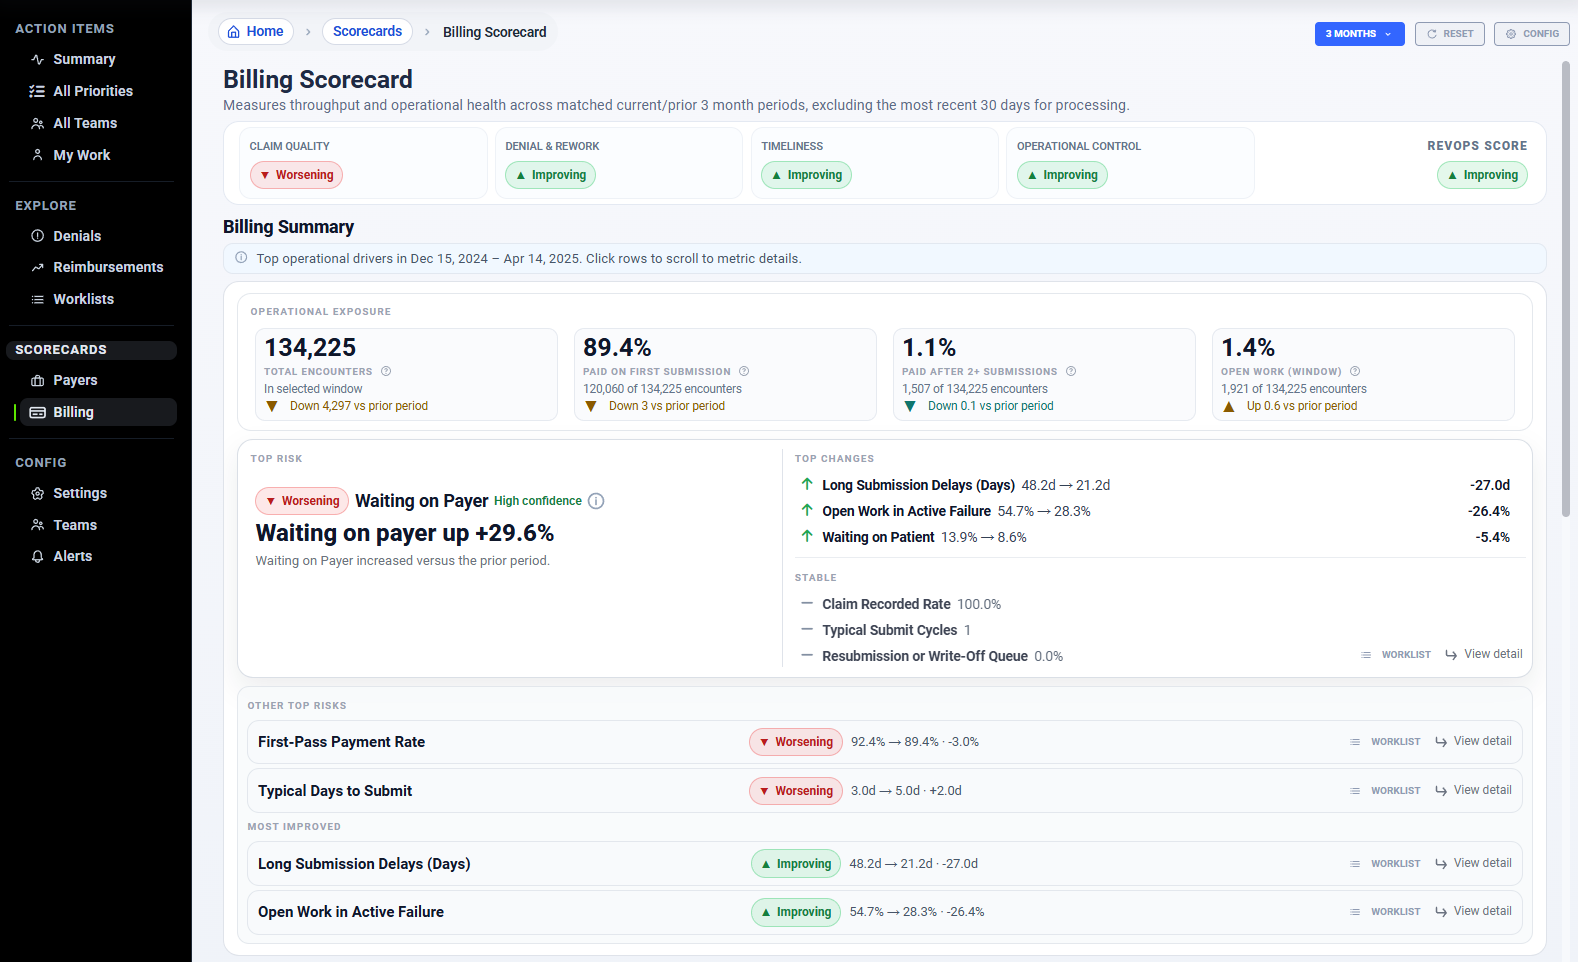
Strong revenue cycle performance depends on strong operational execution.
Track key metrics including:
First pass payment rate
Claims awaiting payer action
Claims awaiting billing action
Claim quality
Operational control
Active denial inventory
Rework
Understand where work is accumulating before it impacts cash flow.
See the Big Picture. Investigate the Details.
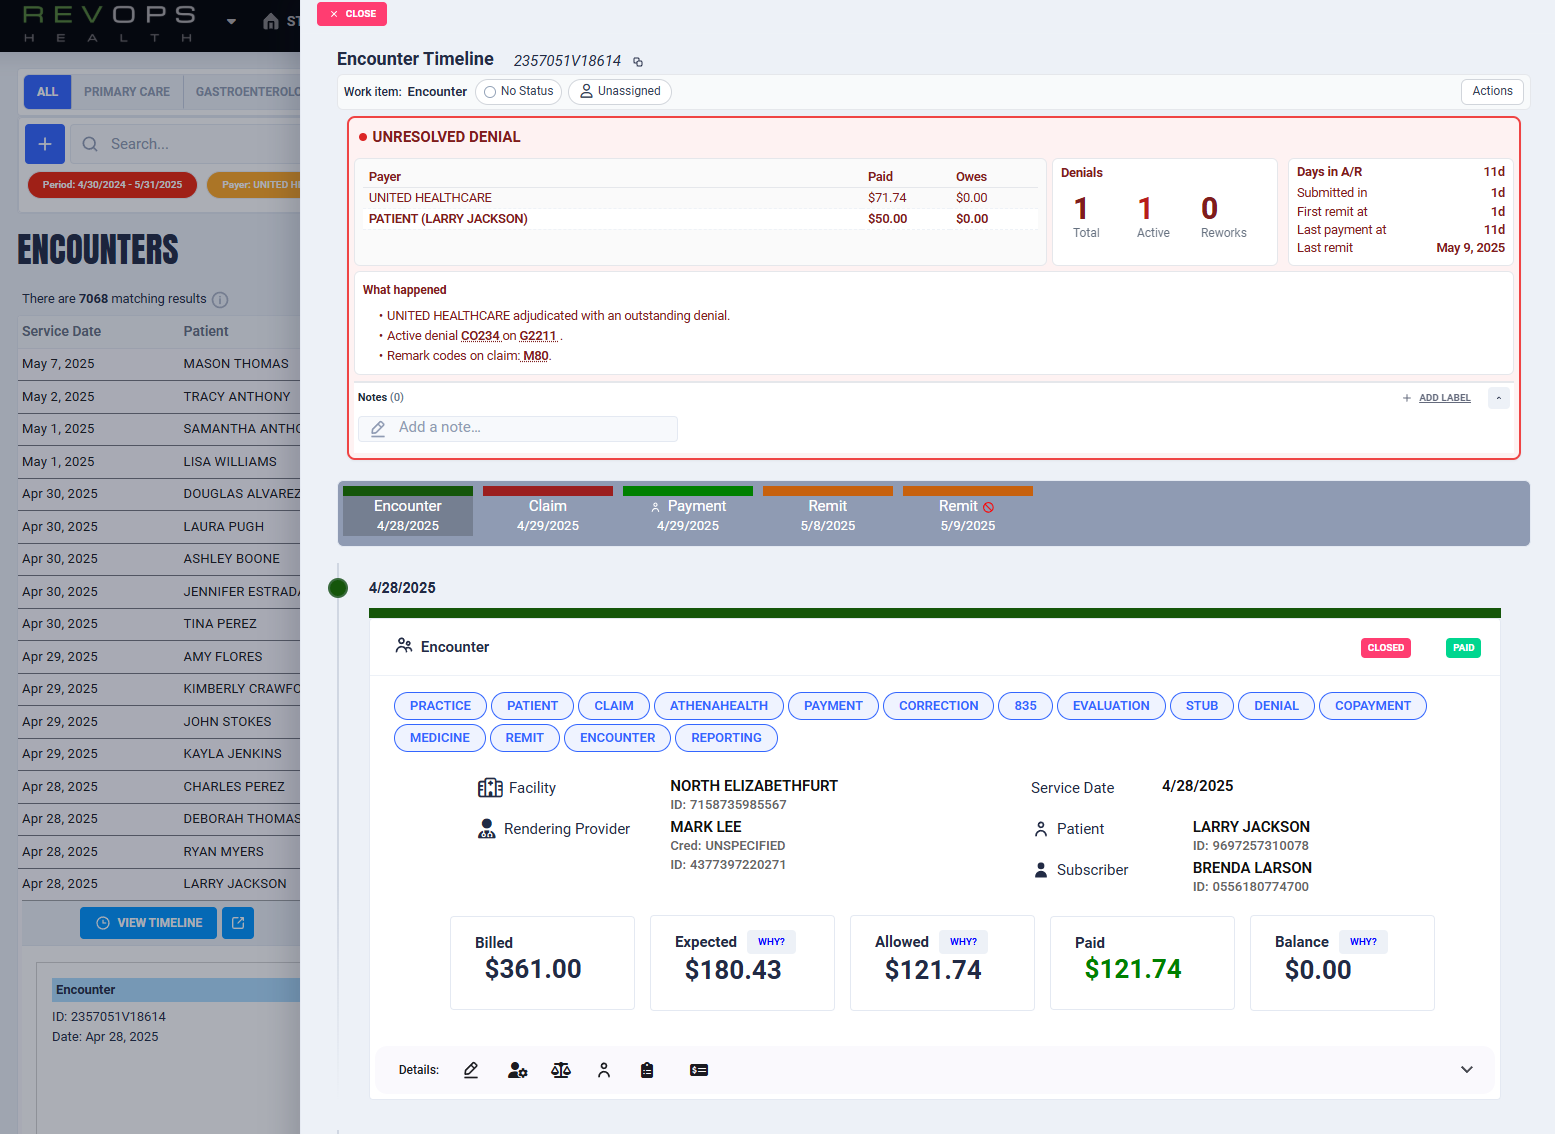
This is where RevOps Health becomes different from traditional reporting tools.
Start with a 30,000 foot view of your entire revenue cycle.
Identify meaningful operational patterns across millions of dollars in reimbursement.
Then drill into the individual claim responsible for those patterns in just a few clicks.
Follow the complete lifecycle of every claim from beginning to end.
Patient encounter
Coding
Claim creation
Submission
Clearinghouse activity
Adjudication
Remittance
Payment
Denial
Appeal or correction
Every chart connects directly to the underlying data.
You never lose context while investigating.
Search Your Revenue Cycle Like Google
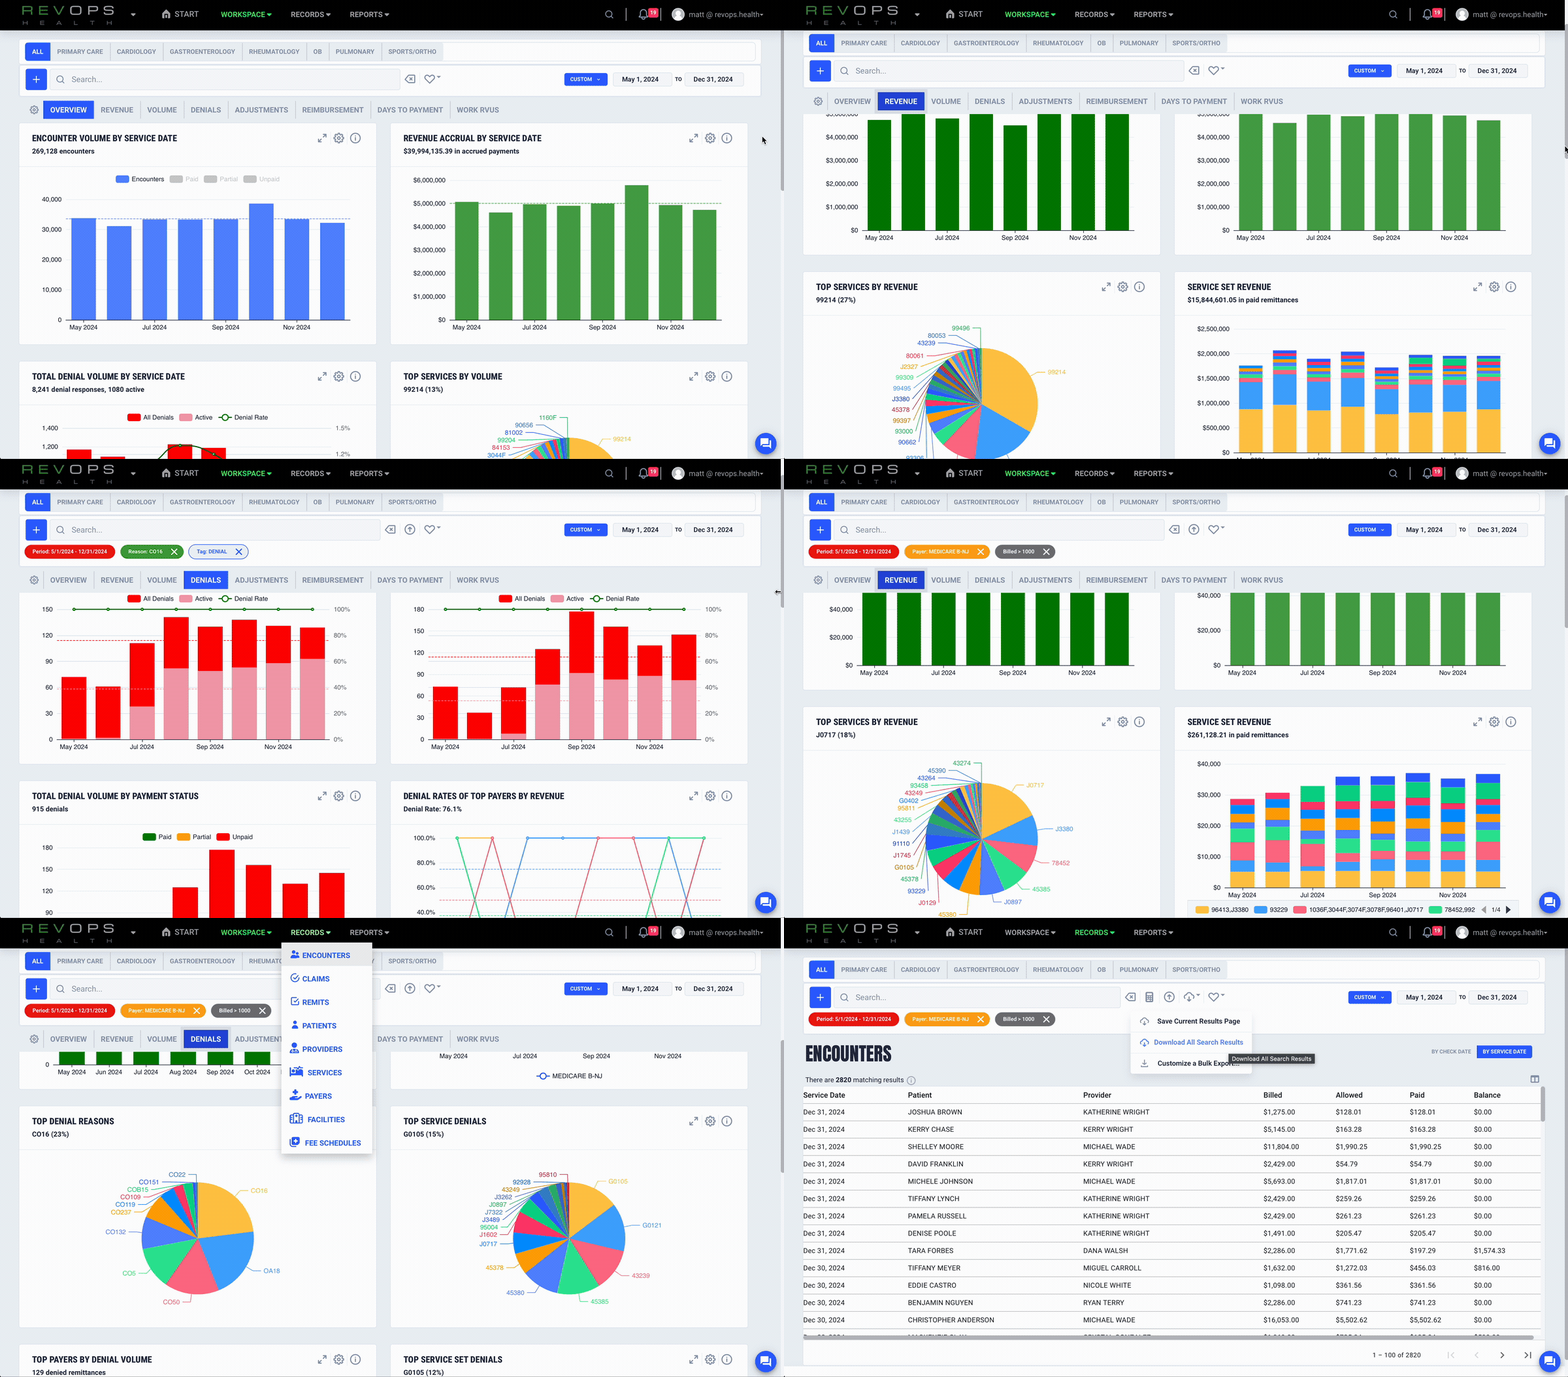
Every claim.
Every remittance.
Every visit.
Every provider.
Instantly searchable.
Whether you're investigating a denial trend across thousands of claims or looking for one specific patient encounter, RevOps Health lets you move through your revenue cycle with the speed and simplicity of search.
Your Data Never Gets Locked Away
At the conclusion of your audit, you may export the complete refined dataset assembled during the engagement.
We'll import, normalize, organize, and connect your claims and remittance data into a single analytical model.
Then it's yours.
Continue investigating internally.
Share findings with your billing partner.
Or keep the dataset as a permanent reference.
Read Only by Design
RevOps Health never changes your production systems.
The audit is completely read only.
We analyze historical billing and remittance information without modifying your practice management system, clearinghouse, billing software, or operational workflows.
Continue Monitoring, If You Choose
The Audit answers one important question.
Where are we today?
Our Surveillance platform answers the next one.
What's changing tomorrow?
Many organizations begin with the Audit to understand the current state of their revenue cycle, then transition into ongoing Surveillance, where data refreshes nightly and new risks are identified automatically as they emerge.
There is no obligation to continue after your audit.
The Audit is designed to provide value on its own.
If continuous monitoring makes sense for your organization, we'll be happy to show you what comes next.
Ready to Audit Your Revenue Cycle?
See where revenue is being lost.
Understand why it's happening.
Investigate every claim.
Leave with a prioritized roadmap for improvement.
Frequently Asked Questions
-
No. The Audit is a one time engagement with a single payment and no recurring charges. Nothing to cancel, it's a fixed window to look at your RCM.
-
The audit is designed to be straightforward and typically begins within one business day.
We execute a Business Associate Agreement (BAA), Master Subscription and Services Agreement (MSSA), and a simple Order Form authorizing a one time audit.
The BAA and MSSA establish how protected health information is handled and confirm that your data remains your data.
The Order Form authorizes RevOps Health to perform a single import of your historical billing and remittance data for the audit.
We import and organize approximately 18 months of historical claims and remittance data into your private audit workspace.
Most audit environments are available within 24 hours after the required data access has been provided.
You receive two weeks of guided access to review findings, investigate opportunities, and export any data you'd like to retain.
The entire process is read only and does not modify your practice management system, clearinghouse, or billing workflows.
-
At the conclusion of the audit, your engagement ends and your audit environment is decommissioned.
You'll have the opportunity to export the refined dataset created during the audit for your own records before access expires.
Once the engagement concludes, RevOps Health removes your imported audit data from our systems in accordance with the agreement. Your data is not retained beyond the audit engagement.
If you choose to continue with RevOps Health Surveillance, we'll execute an updated Order Form under the existing agreements and transition your environment from a one time historical audit to ongoing monitoring. Rather than performing a single historical import, your data will be refreshed nightly so new claims, remittances, denials, and reimbursement activity can be analyzed continuously.
-
Every audit includes 18 months of historical claims and remittance data, providing enough history to identify meaningful reimbursement trends, denial patterns, operational issues, and emerging risks.
-
Your audit includes two weeks of guided access to your audit workspace.
We recommend providing clearinghouse access immediately after purchase so you receive the full audit period.
Most audits are available within 24 hours after receiving the required access.
-
Your audit workspace remains available for two weeks.
Before access ends, you may export the refined dataset created during your engagement.
If you'd like ongoing access with nightly data updates, we can discuss our month to month Surveillance options.
-
No.
The Audit is completely read only and never modifies your practice management system, clearinghouse, billing software, or operational workflows.
-
The Audit analyzes historical billing and remittance data, including claims submitted and remittances received through your clearinghouse.
-
Yes.
The refined dataset created during your audit can be exported at the end of the engagement for continued internal analysis.
-
No.
The Audit is offered at a single fixed price regardless of practice size.
-
Most organizations receive access to their audit workspace within 24 hours after providing the required data access.
-
Many organizations transition from the Audit into RevOps Health Surveillance.
Surveillance refreshes your data nightly, continuously evaluates your revenue cycle, and alerts your team as new risks and opportunities emerge. It is available on a month to month basis based on the number of locations or billing providers.
Stay ahead of revenue problems
Know what is happening, why it matters, and what to do next.