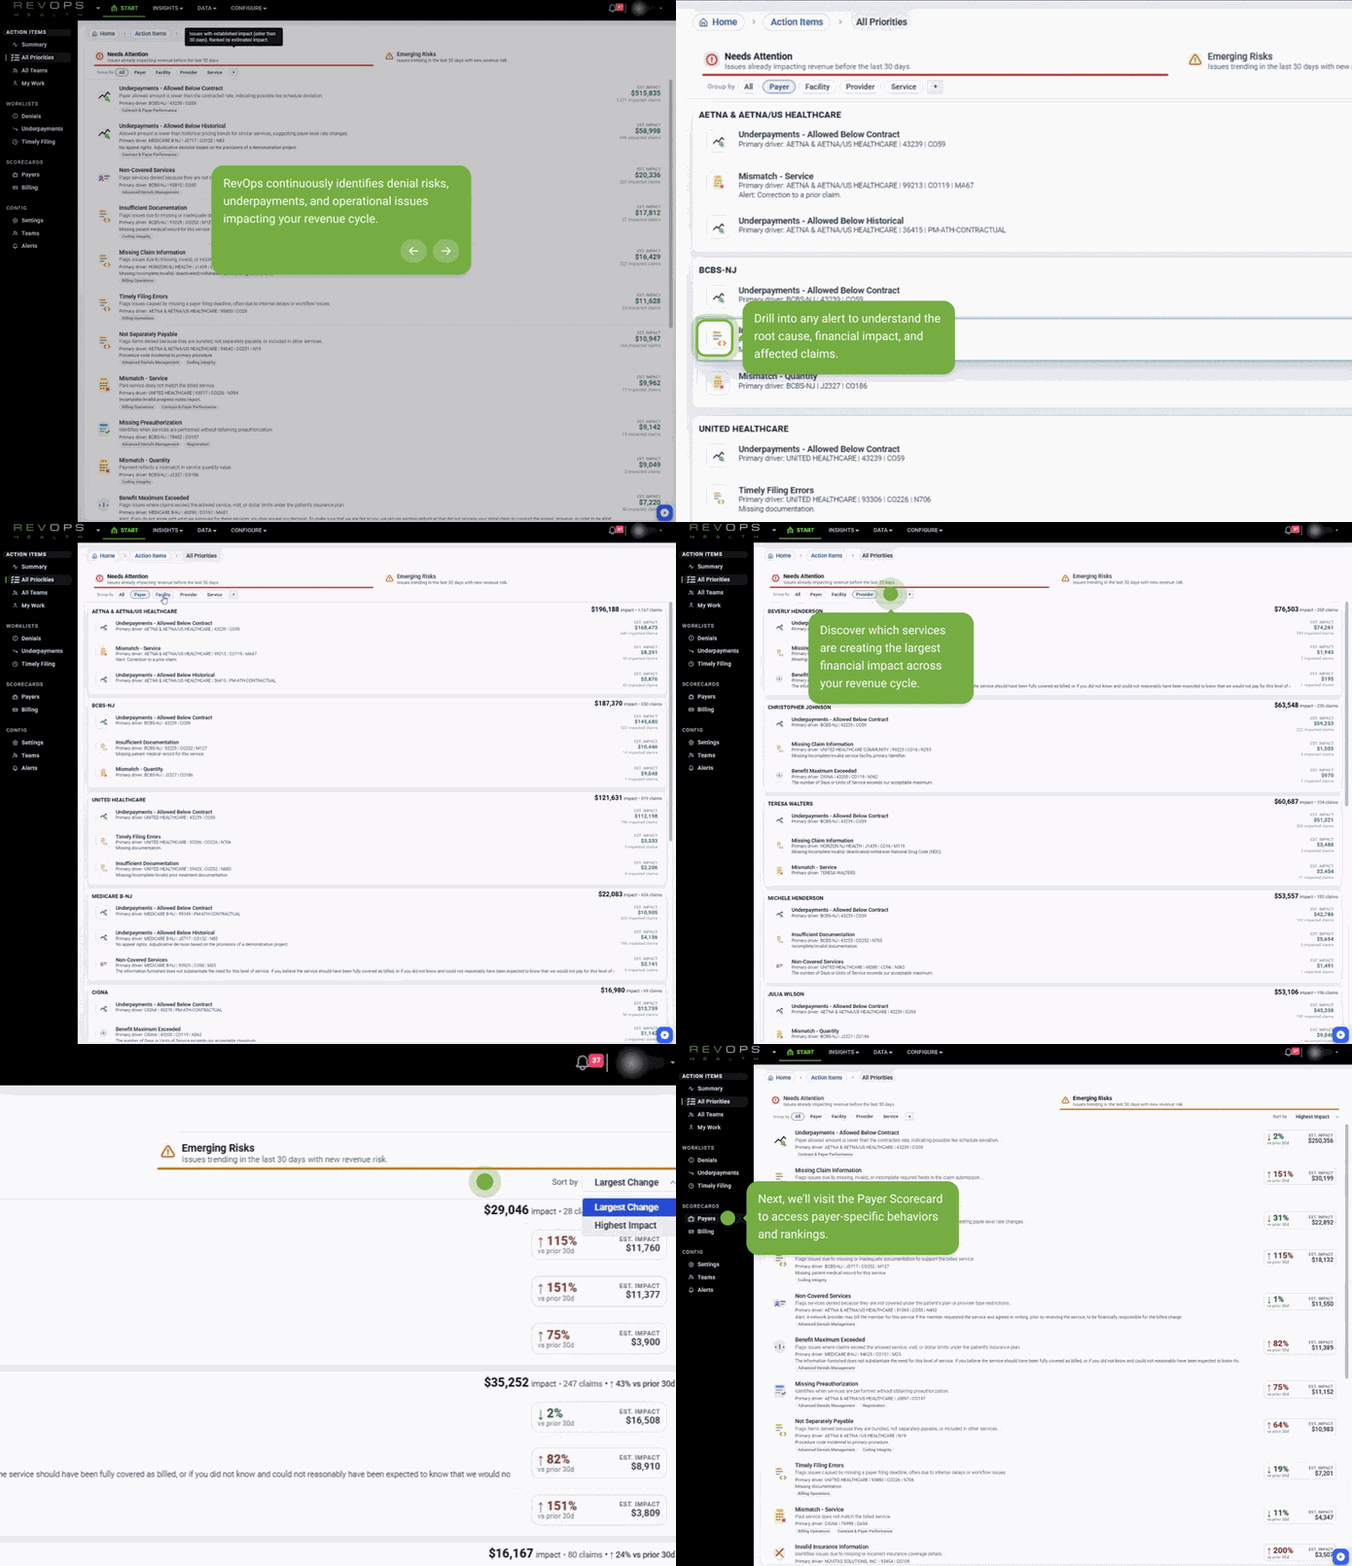
Screenshot showing a web dashboard for RevOps with a green pop-up message stating, 'RevOps continuously identifies denial risks, underpayments, and operational issues impacting your revenue cycle.' The dashboard displays various categories related to insurance claims and financial metrics.

REAL TIME CLARITY FOR YOUR ENTIRE REVENUE CYCLE

The RevOps Health platform gives clinics and provider groups real-time revenue intelligence that blends claims, remittances, and payer behavior into one live view. Teams gain clarity across their entire revenue cycle, uncovering lost revenue, detecting payer anomalies early, and making confident decisions backed by data.

A tall, green plant with a thin, elongated stem and leafy branches.
A very tall, thin, green cactus with a single arm extending from the side against a plain background.
A tall, thin, green cactus with a small branch halfway up, set against a plain background.

REVENUE CYCLE TEAMS ARE EXPECTED TO SOLVE PROBLEMS THEY CANNOT SEE

NO REAL-TIME VISIBILITY

Leadership relies on delayed or incomplete reporting, which makes it difficult to see what is happening in real time or make confident decisions.

A close-up image of a computer keyboard with black keys and white letters.

REACTIVE WORKFLOWS

Managers spend hours gathering data and chasing issues, often discovering problems only after they affect cash flow and disrupt daily operations.

A computer screen displaying a software development or data analysis interface with graphs, code, and data visualizations.

FRAGMENTED SYSTEMS

Claims, remittances, and practice data sit in separate systems, hiding payer behavior patterns and slowing the analysis teams need to stay ahead.

A close-up of a green plant or grass with a blurred background.

MANUAL INVESTIGATIONS

Analysts struggle with rigid tools and manual exports that make tracing anomalies slow, difficult, and dependent on time consuming spreadsheets.

YOUR COMMAND CENTER FOR REVENUE OPERATIONS

Built to give executives, managers, and analysts a shared source of truth.
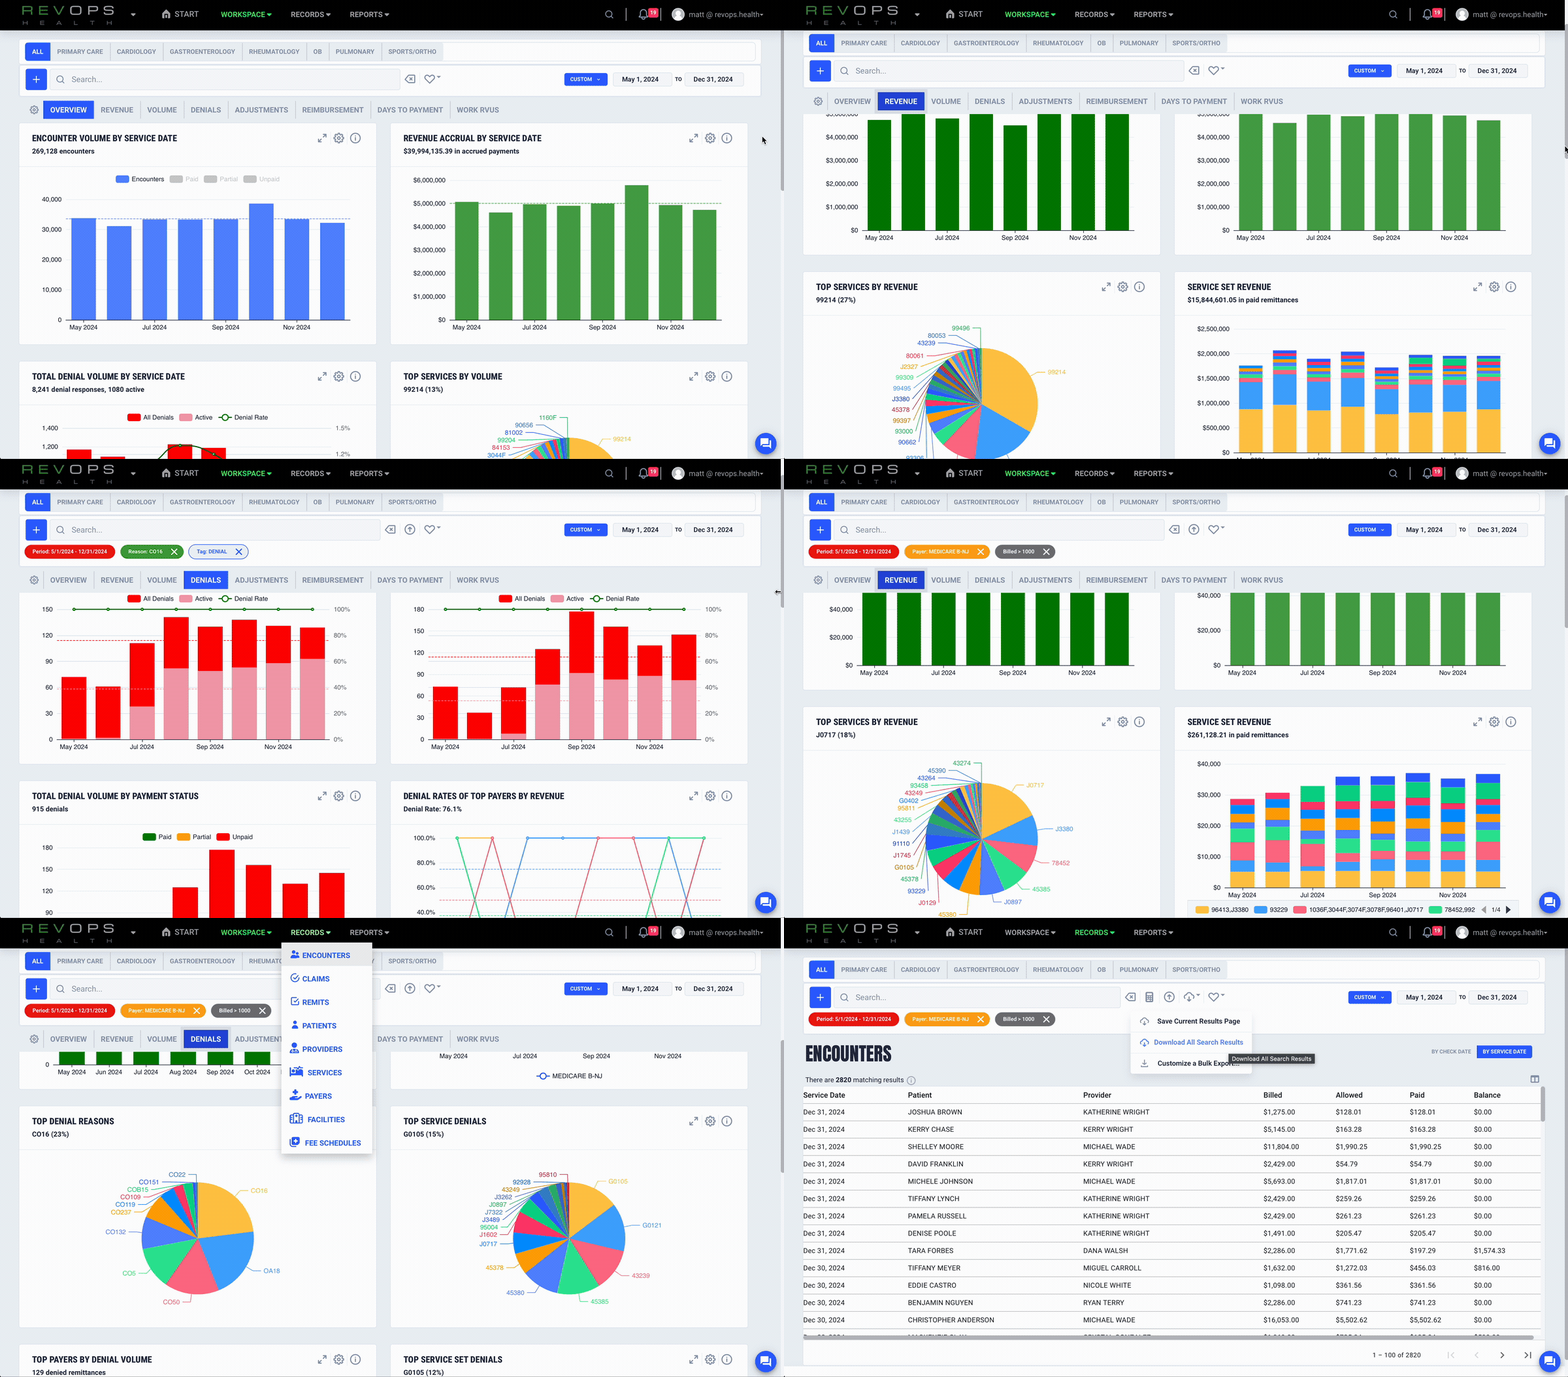
Dashboard view of Revops Health platform showing service encounter volume, revenue by service date, total denial volume, and top services by volume with data for May to December 2024.

See lost revenue in real time

Enabling customers to identify missing, underpaid, and preventable denied claims as they happen. You see quantified financial impact and get evidence for recovery.

Black right-pointing arrow icon on a white circular background
Black arrow pointing to the right inside a white circle with a black border.
Black arrow pointing to the right inside a black circle on a white background.
A black greater-than symbol inside a white circle.

Spot preventable denials instantly

Compare allowed amounts and contracted rates

Identify underpayments

Prioritize high impact issues with real numbers
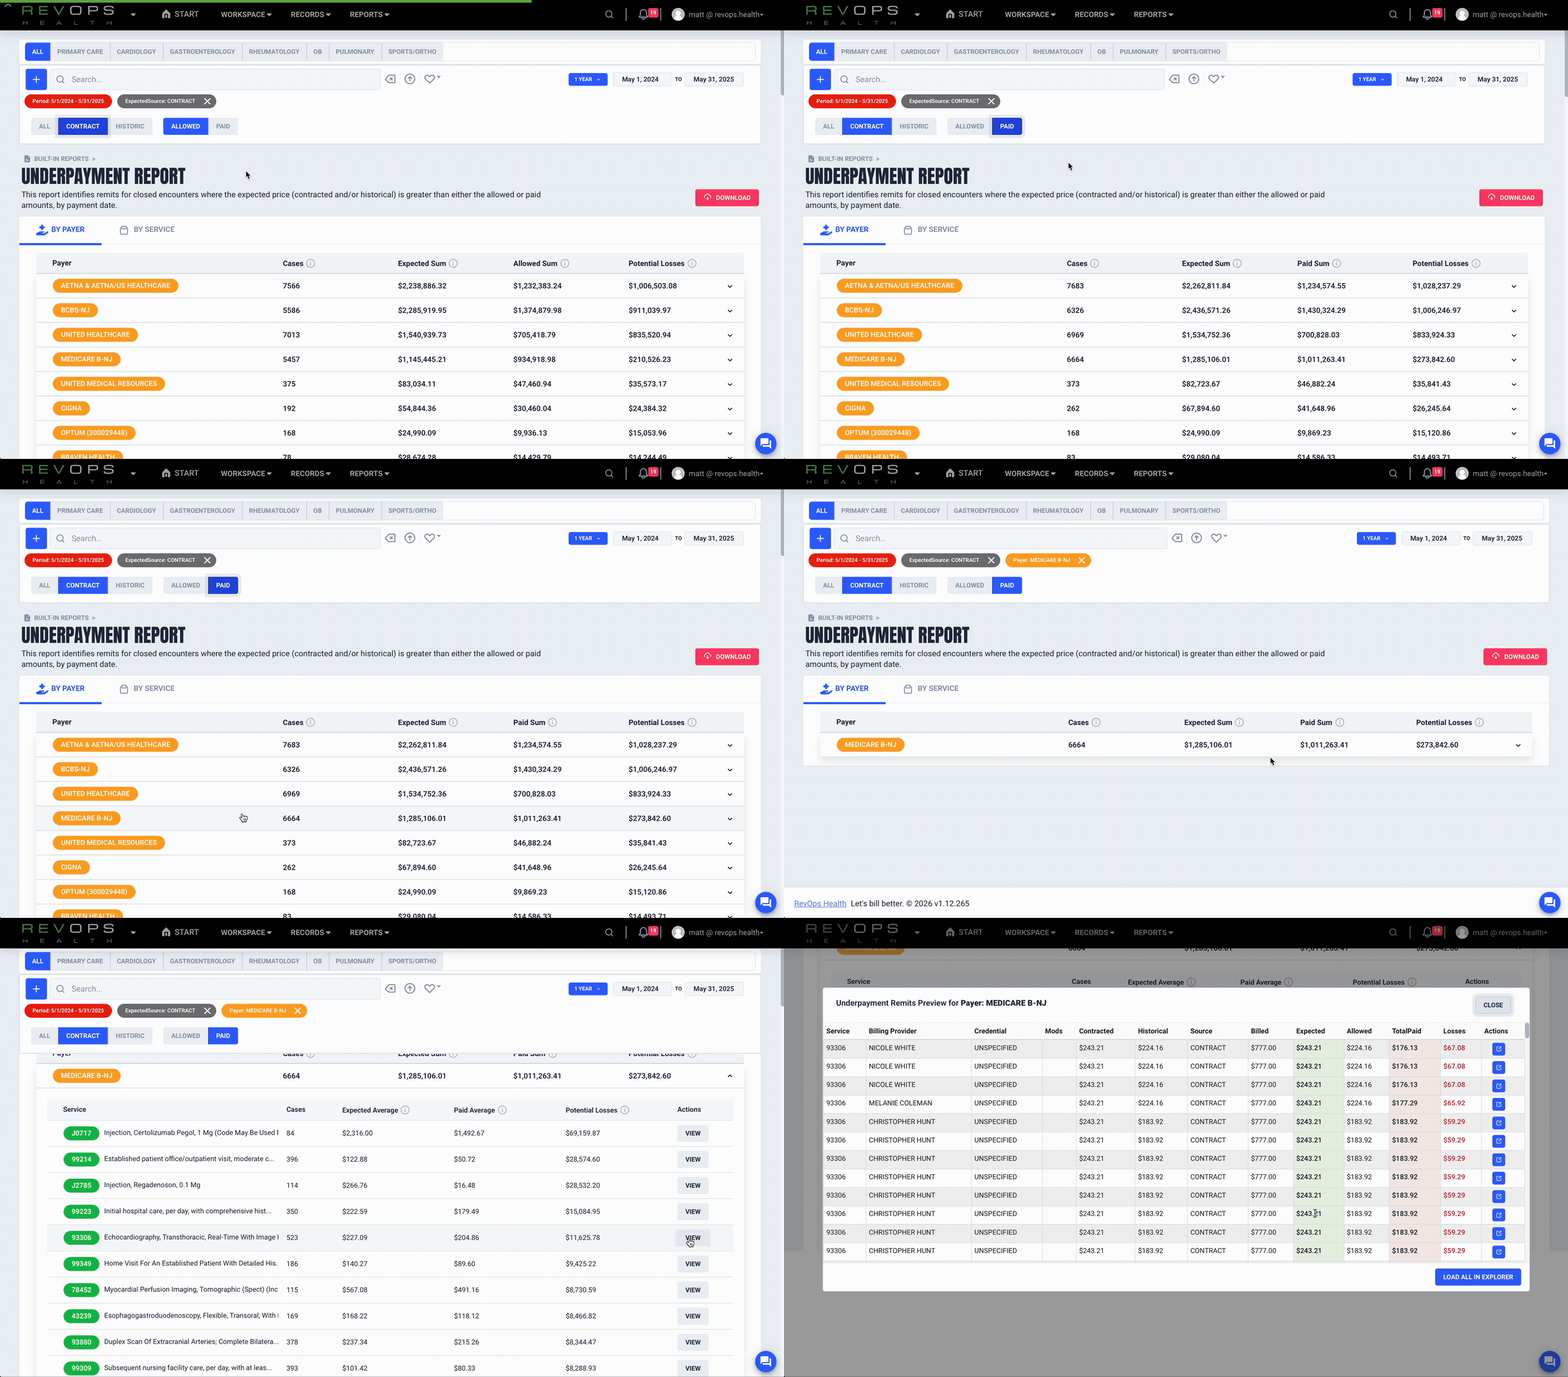
Screenshot of an online health insurance underpayment report from REVOps HEALTH, showing a list of healthcare providers, the number of cases, expected and allowed sums, and potential losses, with a date range from May 1, 2024, to May 31, 2025.

Detect payer behavior shifts early

The RevOps platform builds a digital fingerprint for each payer and alerts you when reimbursement patterns change so you can respond before cash flow is affected.

Circle icon with a black right arrow inside.
A black command prompt icon with a right-pointing arrow inside a white circle.
A black right-pointing chevron arrow within a white circle on a black background.
A white circle with a black arrow pointing to the right in the center.

Monitor every payer at a service line level

Catch pattern shifts early

Generate evidence packets

Strengthen payer accountability
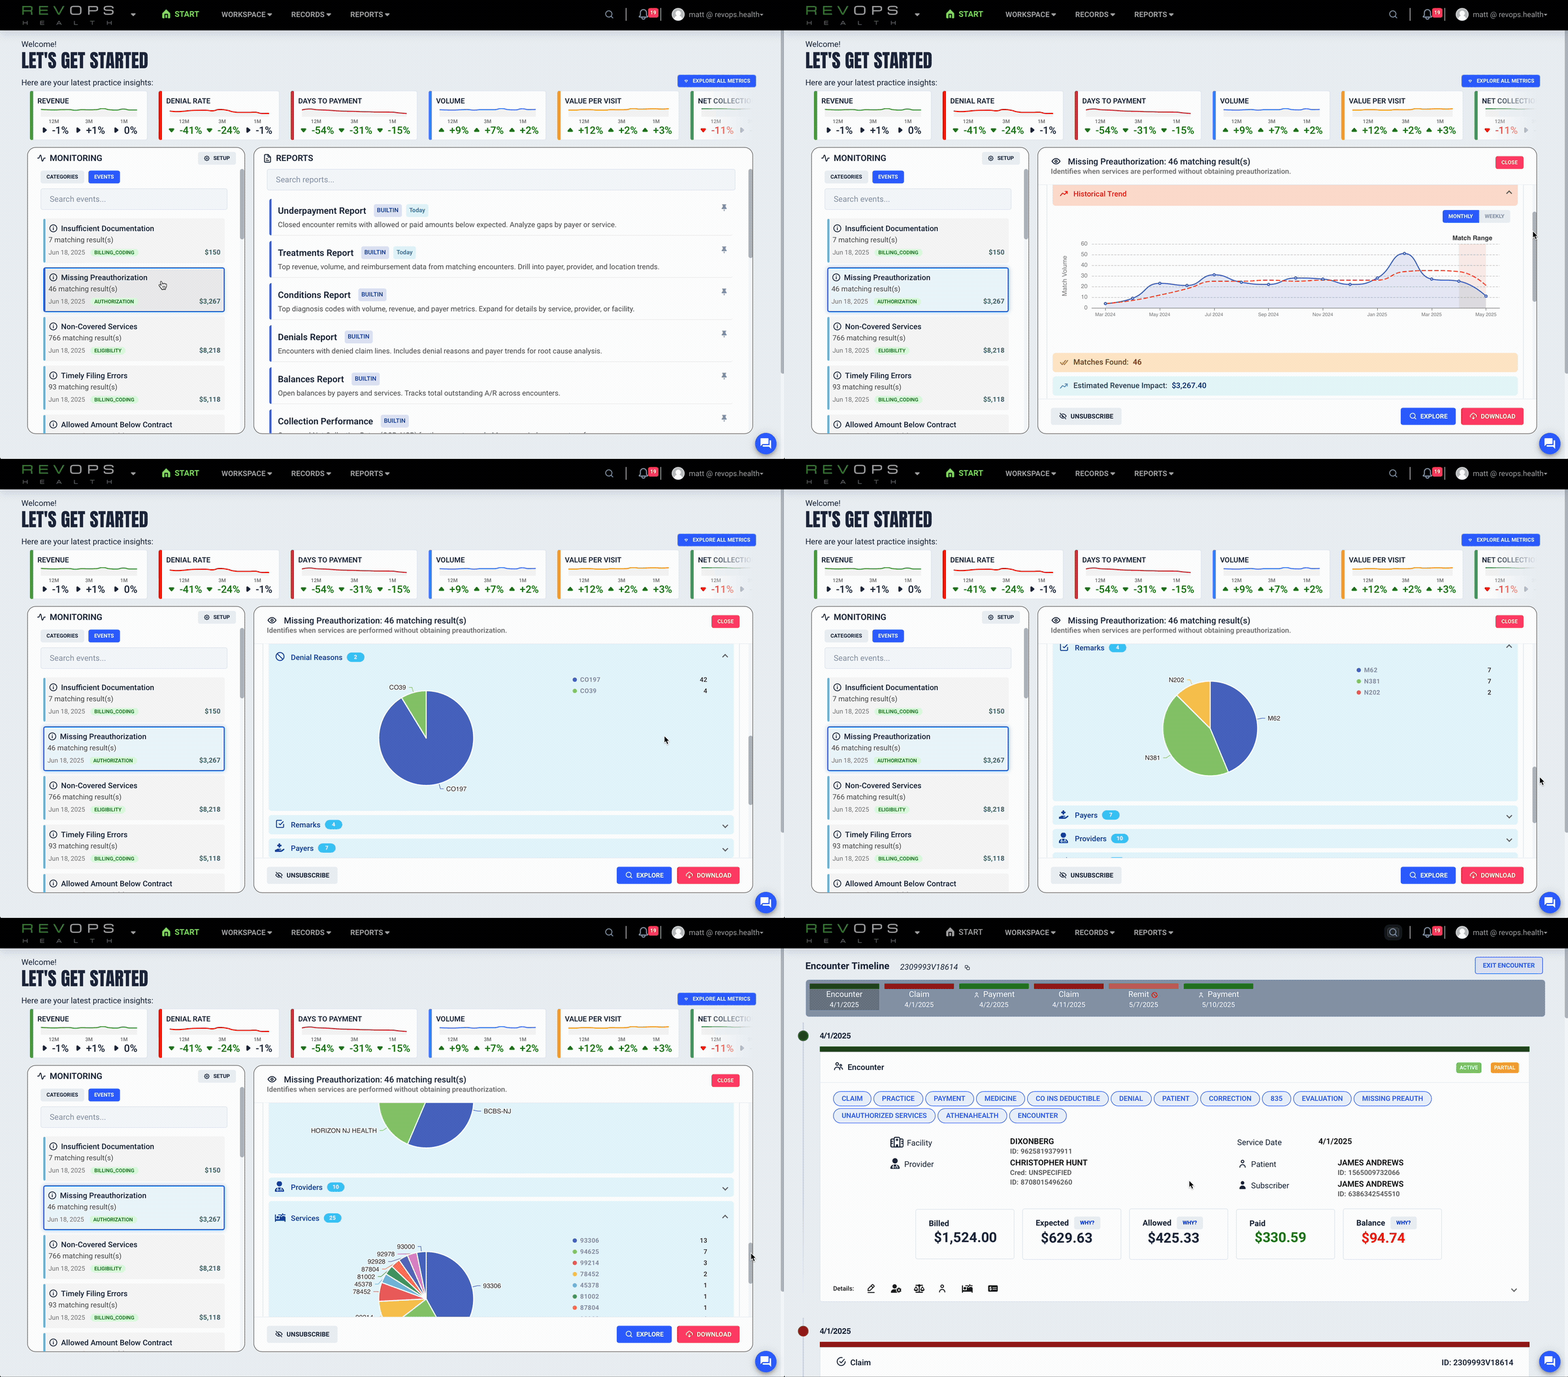
Screenshot of a healthcare analytics dashboard from RevOps Health showing practice insights, metrics, and reports.

Understand what drives your KPIs

RevOps connects claims, remittances, and practice data to reveal the drivers behind KPI changes. This makes root cause analysis simple, reliable, and fast.

A black right arrow icon inside a white circle background.
A black right-pointing arrow icon on a white circular background.
A white power button icon on a black background.
Power button icon with a clockwise arrow symbol inside a circle.

Reveal operational inefficiencies

Trace problems to their source

Track denial patterns

Improve team performance
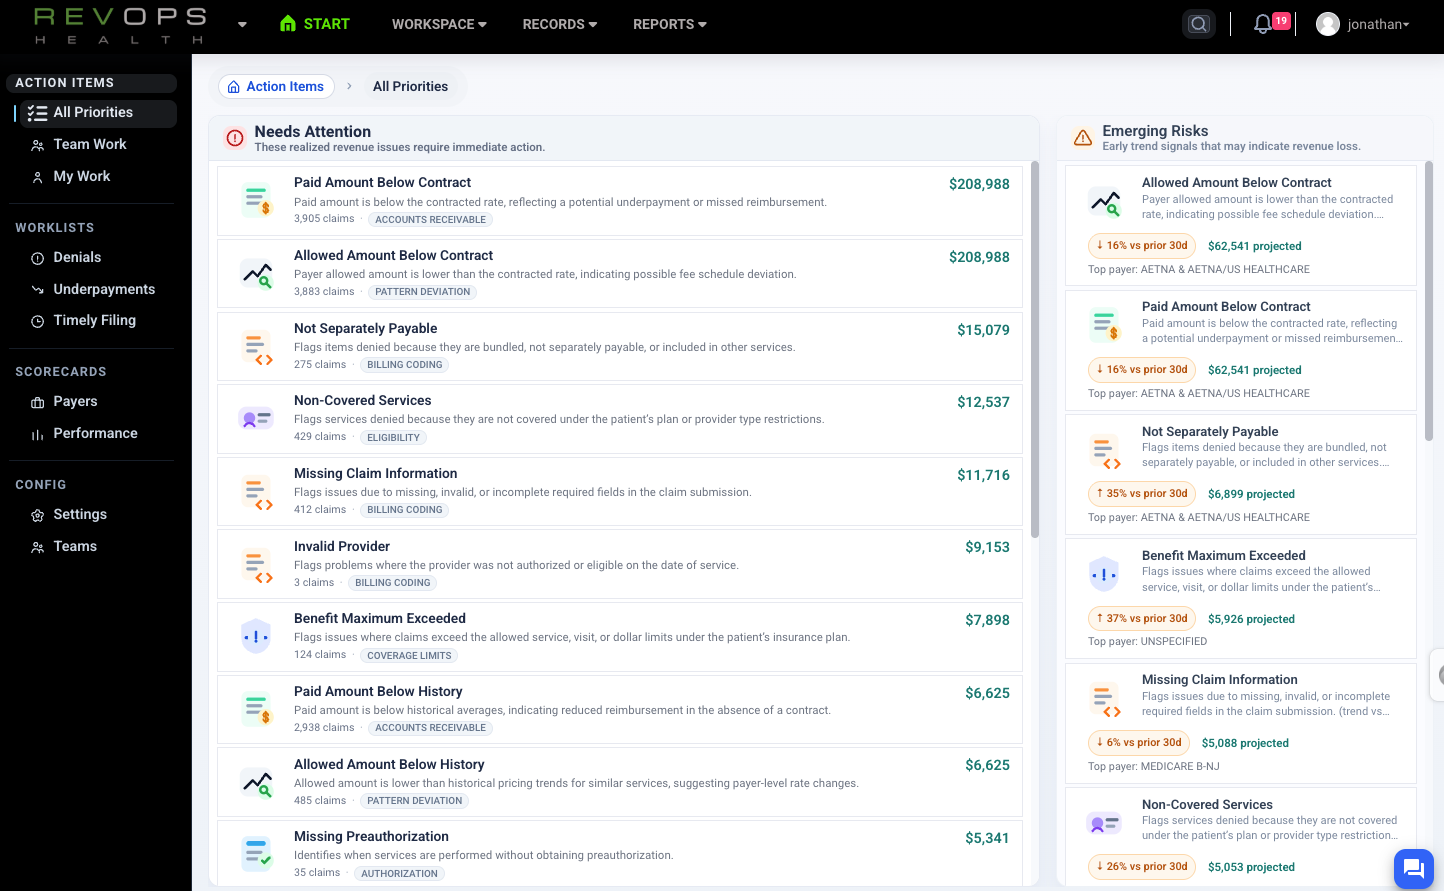
Screenshot of a healthcare revenue management dashboard from RevOps Health showing action items like claims with issues such as 'Needs Attention,' 'Emerging Risks,' 'Paid Amount Below Contract,' 'Allowed Amount Below Contract,' 'Not Separately Payable,' 'Non-Covered Services,' 'Missing Claim Information,' 'Invalid Provider,' 'Benefit Maximum Exceeded,' 'Paid Amount Below History,' 'Allowed Amount Below History,' 'Missing Preauthorization.' The dashboard includes sections for priorities, team work, reports, and a user profile icon in the top right corner.

Financial clarity
See where revenue is lost and how much can be recovered.

Text icon with a black greater than symbol inside a white circle

Operational confidence
Understand the real drivers behind performance changes.

A black right arrow symbol inside a white circle.

Faster decisions
Move from slow reporting to real time insight.

A black and white right arrow symbol inside a circular outline.

Payer accountability
Catch anomalies early and support every claim with data.

A black arrow pointing to the right inside a white circle with a black border.
Five professionals participating in a meeting in a modern office, with laptops and a tablet on the table.

BUILT FOR ANY SPECIALTY, PRACTICE SIZE, OR BILLING MODEL

Independent clinics, provider groups, multi site practices, MSOs, networks, and organizations with limited analytics capacity.