
SEE THE REVENUE IMAGING CENTERS ROUTINELY LOSE
Protect margin. Reduce denials. Get paid faster.
Imaging centers run on high-dollar studies, technical-and-professional splits, and prior authorizations where a single error can cost an entire scan. RevOps Health gives your center real-time visibility into every claim and dollar, so your team can focus on patients, not payment problems.


SURGERY CENTER BILLING HAS ITS OWN RULES. AND ITS OWN TRAPS.
PROFESSIONAL & TECHNICAL SPLITS
Imaging claims split technical and professional components, and one modifier or split-billing error quietly drains revenue on every study.

PRIOR AUTHS ON ADVANCED IMAGING
MRIs, CTs, and PET scans hinge on authorizations that are easy to miss or let expire, and when they slip, high-dollar claims deny with no warning.
CONTRAST AND SUPPLY BILLING
Contrast agents and supplies mix drug and administration codes, and missing components leave significant reimbursement on the table.
MEDICAL NECESSITY DENIALS
Payers scrutinize advanced imaging closely, and any gap in documentation or indication turns a valid study into a costly denial.
STOP LOSING REVENUE YOU ALREADY EARNED
Catch coding and split-billing errors before they cost you
RevOps Health flags coding, component, and authorization issues on imaging claims before submission, so a single mistake doesn't turn a high-dollar study into a denial. Your team fixes the pattern once instead of chasing appeals for weeks.
- Pre-submission checks on every imaging claim
- Technical/professional split and authorization validation
- Fix the root pattern once, not one claim at a time

Spot payer patterns unique to imaging centers
See how each payer actually behaves on your imaging claims: which ones delay studies, downcode components, or deny on medical necessity, and why. RevOps Health surfaces these patterns early so you can act before they cost you a quarter of revenue.
- Payer-by-payer behavior scorecards
- Early alerts on delays, downcoding, and denials
- Act on trends before they compound

Track study and component revenue in one view
Advanced imaging, contrast studies, and split-component billing carry complex, high-value revenue that's easy to lose track of across systems. RevOps Health brings that revenue into a single live view so nothing falls through the cracks.
- Unified view of study and component billing
- High-value claims tracked in real time
- No revenue lost between systems

Recover underpayments on studies and components
When a payer underpays a technical or professional component, that gap can mean thousands lost across a month of studies. RevOps Health detects underpayments against your contracted rates and flags them for recovery automatically.
- Automatic detection against contracted rates
- Catches underpaid technical and professional components
- Flags every recoverable dollar for follow-up

HOW WE HELP IMAGING CENTERS OPERATORS
Evaluate lost revenue and identify recovery opportunities
Customer use cases focused on uncovering hidden inefficiencies, recovering lost revenue, and optimizing financial operations for better cash flow and ROI.
Generate payer digital fingerprints and detect anomalies early
Customer use cases focused on uncovering hidden inefficiencies, recovering lost revenue, and optimizing financial operations for better cash flow and ROI.

Identify operational inefficiencies and root cause analysis
Customer use cases addressing reduction of operational bottlenecks, improving denial management processes, and transitioning to data driven resource allocation.
Surface real time revenue performance and prioritize action by impact
Customer use cases on improving reporting accuracy, aligning performance metrics, and leveraging analytics for better decision-making.
Enable data driven growth decisions with clear financial visibility
Customer use cases on leveraging data to guide strategic growth, improve marketing effectiveness, and drive operational scalability.




COMMON CHALLENGES SOLVED
High denial rates from documentation and coding issues

Underpayments from payer policies and fee schedule variance
Delayed payments and missing remittances
Modifier misuse and level-of-service denials
Lack of visibility across multiple locations and providers
SEE REVENUE OPPORTUNITIES IN REAL TIME
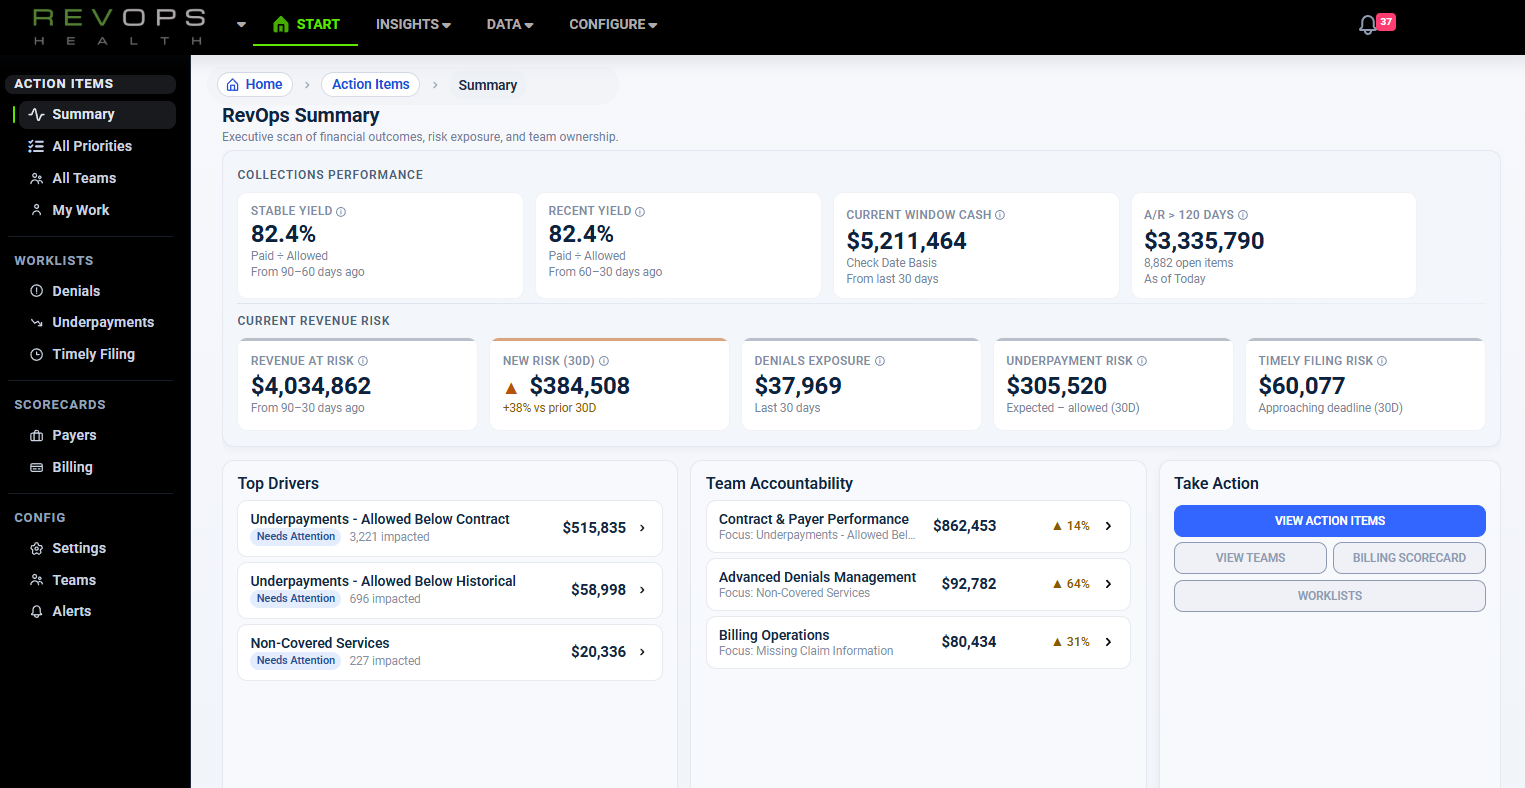

RECOVER YOUR REVENUE
Payer surveillance.
Real-time analytics.
Irrefutable evidence.
Launch your command center, now.